Everything that a scientist does starts off on a small scale. And with this particular bit of work, we have to test out all of our variables, plot out all the points and show everyone a graph of one of the possible outcomes of a rocket takeoff. Of course this is all small scale, and so we started off with just a rough story-line and graph of what we need to do.
To do this we are using a motion detector and a simple movement by a scientist in order to have a digital graph of what might happen with the motion of our rocket in relation to space and time. We only have a three meter area and about 20 seconds that the detector will record, so we have to REALLY scale everything down and manually do the graph points.
To do this we are using a motion detector and a simple movement by a scientist in order to have a digital graph of what might happen with the motion of our rocket in relation to space and time. We only have a three meter area and about 20 seconds that the detector will record, so we have to REALLY scale everything down and manually do the graph points.
How fast and high does a rocket go? and how are we going to scale it down? |
Assuming that we are attempting to achieve low earth orbit the rocket will have to be able to reach 3000 km in 6 minutes at a speed of 17000 km/hr (about 456 km/minute). We can assume that the first part is then 6 seconds with a one second delay on the launch pad(for motion detector purposes), and that we are only going 3 meters at .4 meters every second for four more seconds, an easily estimable pace. Afterwords we have to stay at a constant speed for two more seconds, and then a variable negative velocity for four more seconds
|
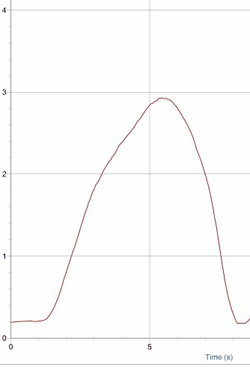
We weren't able to precisely follow those calculations, but the general idea is the same. In the graph shown, we start of still, we accelerate at a variable positive velocity, then at a constant velocity, then a shift to a variable negative velocity, after which the vehicle crashes.
